Listeners of the Sound of Hockey podcast have probably heard Darren and me refer to our favorite NHL teams’ divisions as “stacked”. Darren is still riding the fantasy world, known as the first 6 weeks of the season, when the Central Division had a quiver of teams that could legitimately make a run at a cup. Nashville, Minnesota, Winnipeg, Colorado, and Dallas were all playing solid hockey. Meanwhile on my end, the Pacific Division looked like the division that no one wanted to win. But the season is long, my friends, and things tend to balance out.
So that begs the question, what is the best division in the NHL (so far) this year? Certainly, the Atlantic Division has a claim to the title with Tampa on a ridiculous pace to capture 125 points. But is one really good team enough to determine the best division in the NHL? Of course not.
Primer
Let’s first establish a way to look at a team’s performance that is agnostic to how many games the team has played. Just looking at points earned is not a good system, since certain teams will have played significantly more games than other teams; therefore, gaining an opportunity to obtain more points.
Let’s look at ‘Percent of Points Obtained’. The calculation is rather simple. For every game played, a team has the opportunity to obtain 2 points, so it is simply a # of points divided by (# of games played * 2 possible points). i.e. if Tampa Bay has played 10 games and they have 14 points to show for it, their % of points obtained would be 70% (14 points/ (10 games played * 2 possible points per game)). Keep in mind that there are scenarios where a losing team gets one point (loss in overtime or shootout) and the winning team gets 2, but the max point value for any one team is still 2. Even though the entire game might give out 3 points.
The Data
The next set of visuals is intended to help you answer that question for yourself and provide you with a different perspective on evaluating teams and divisions across the league.
By Division

That might be good enough for some people, but aggregating the division might be hiding some outliers (a.k.a. Tampa or Chicago). Let’s look at how many teams inside each division are above league average.

Based on the above chart, the Atlantic division has five above average teams, while all other divisions have four. Interesting to see that both the Pacific and the Central divisions have a team that gets less than 40-percent of the available points-per-game. Implying that they are easy opponents from which to earn points. Another interesting way of looking at the divisions this way is that certainly the Atlantic has a lot of strong teams with five of the eight teams above the league average at earning points compared to the Metropolitan and Pacific with four teams above average and four teams below average. And then there is the Central…the Central is the only division with seven teams, four of which are above average.
Assessment
Based on the first two visuals, I think it is safe to assume that the Atlantic is the best division, but you could also argue that they have two of the weakest teams (Florida & Ottawa) which could make the Atlantic a weaker division. Since those weaker teams are playing inside their division more frequently, this increases the points the other teams in the division can earn.
Bottom line, evaluating which division is best is subjective and really depends how you define “best” in the league. How would you define “best”? I could evaluate based on your criteria in a future post.
Bonus Content
Now I didn’t really stop there on my analysis, since there are always additional layers to the onion. Here is how the divisions fared head to head:

The chart shows that as a division, the Atlantic gets the highest percent of points (65%) from the Pacific Division, but gets the least points from the Central Division (46%). Meanwhile the Metropolitan Division is the only division that obtains over 50-percent of the points from every division.
Drilling down another level, you can see which teams give certain divisions the biggest challenge.

This shows how individual teams fare against opponents from each division.
No surprise, Tampa Bay doesn’t discriminate who they beat up, but they particularly like to beat up on the Metropolitan Division taking 92-percent of the points available in those games. Other items of note are that Washington is particularly tough on Eastern Conference divisions gathering 71-percent of points from the Atlantic and 81-percent of points from their own Metropolitan. On the other side of the fence, Minnesota is having a horrible time against Metropolitan Division opponents, mustering only one point in their six games (12 possible points) against that division.
Now if you really want to go nuts, here is a breakdown of every team’s performance against each team in the league.
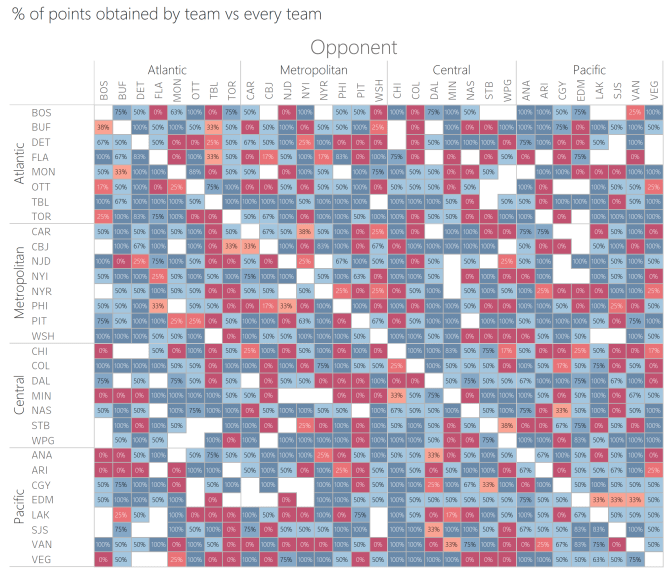
Note that some match-ups will sum more than 100-percent due to the three-point games (or occasionally referred to as the loser point). For example, Boston gets 75-percent of the points available when playing Buffalo while Buffalo gets 38-percent of the points available when playing Boston. You math whizzes will probably see that 75% + 38% is more than 100-percent, specifically 113-percent. That’s because Boston has won 3-out-of-4 games against Buffalo, so six points out of eight available. Buffalo won just one game and lost three, but one of those losses came in overtime, earning them one additional point. In total, that gets them three points out of a possible eight, or 38-percent.
There is never one way to evaluate a team’s success. Factors like strength of schedule, injuries, roster changes, and, oh yeah, luck all come into play. Hopefully, I gave you a different way of thinking about evaluating teams and divisions.


Leave a Reply